Compressor
From Audacity Manual

- Accessed by:

Graph
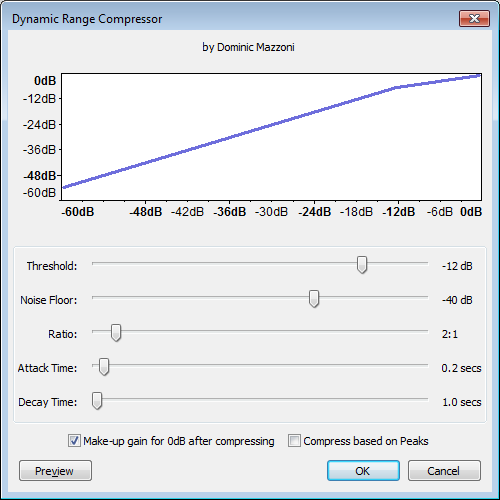
The graph shows the input level along the bottom (horizontal axis) and the output level scale on the left (vertical axis) to illustrate the dynamic range compression effect. The graph will change as you adjust the Threshold and Ratio sliders, reflecting the settings made. The actual characteristics of the effect is also dependent on the other settings (not shown in the graph).
Controls
- Threshold: Compression is applied to sounds above this level.
- Noise Floor: This setting helps to prevent low level sound (background noise below this level) from being unduly amplified as a result of the processing.
- Ratio: The amount of compression applied to the audio once it passes the threshold level. The higher the Ratio the more the loud parts of the audio will be compressed. The Ratio sets the slope of the blue line on the graph above the threshold.
- Attack Time: How soon the compressor starts to compress the dynamics after the threshold is exceeded. If volume changes are slow, you can push this to a high value. Short attack times will result in a fast response to sudden, loud sounds, but will make the changes in volume much more obvious to listeners.
- Decay Time: How soon the compressor starts to release the volume level back to normal after the level drops below the threshold. A long time value will tend to lose quiet sounds that come after loud ones, but will avoid the volume being raised too much during short quiet sections like pauses in speech.
- Make-up gain for 0 dB after compressing: Boosts the resultant audio after compression to a peak level of 0dB.
- Compress based on Peaks: The threshold and gain adjustment are based on peak values of the waveform rather than the average (RMS) value. The method used for compressing dynamics is different when this option is selected. When not selected, the compressor reduces the volume of louder sounds while leaving quieter ones untouched, but when "compress based on peaks" is selected, quieter sounds are amplified more than loud sounds. The result in both cases is to reduce the dynamic range of sounds above the threshold.
The illustration below compares characteristics of compression based on peak (red) and RMS (blue) levels (before make-up gain).

Schematic example
Uncompressed:
A simple sine wave that drops off by 6 dB half way through the selection, to demonstrate how some
compressors handle signals.

After:
The attack part of where the compressor is working is clearly
visible at the start of the audio.The release part still affects some audio that is beneath the
threshold as the compressor gain change slowly ebbs out and the material
fades back to normal level.


